24,99 €
inkl. MwSt.
Versandkostenfrei*
Versandfertig in 6-10 Tagen
payback
12 °P sammeln
  • Broschiertes Buch

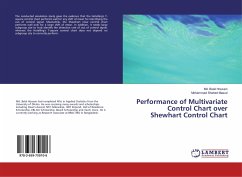
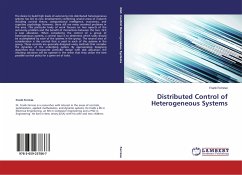
The conducted simulation study gives the evidence that the Hotelling's T-square control chart performs well for any shift of mean for identifying the out of control signal. Meanwhile, the Shewhart x-bar control chart performs well only for a large shift of mean. In addition, it needs large subgroup size to truly identify the detection rate of out of control signal, whereas the Hotelling's T-square control chart does not depend on subgroup size to correctly perform.

Produktbeschreibung
The conducted simulation study gives the evidence that the Hotelling's T-square control chart performs well for any shift of mean for identifying the out of control signal. Meanwhile, the Shewhart x-bar control chart performs well only for a large shift of mean. In addition, it needs large subgroup size to truly identify the detection rate of out of control signal, whereas the Hotelling's T-square control chart does not depend on subgroup size to correctly perform.
Autorenporträt
Dr. Md. Belal Hossain (Ph.D. in Biologia Molecolare) Nato il 21 agosto 1980. Nazionalità: Bangladeshi. Lavora presso il dipartimento di Patologia vegetale dell'Università Agraria Sher-e-Bangla, Dhaka-1207.