Nigel Walford
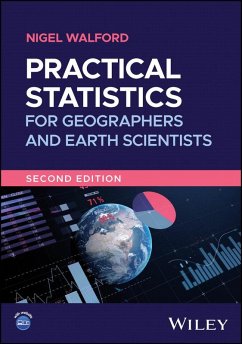
Practical Statistics for Geographers and Earth Scientists
Nigel Walford
Practical Statistics for Geographers and Earth Scientists
- Broschiertes Buch
- Merkliste
- Auf die Merkliste
- Bewerten Bewerten
- Teilen
- Produkt teilen
- Produkterinnerung
- Produkterinnerung
A practice-oriented and accessible introduction to geographical statistics
In the newly revised Second Edition of Practical Statistics for Geographers and Earth Scientists, distinguished researcher Nigel Walford delivers an authoritative and easy-to-follow introduction to the principles and applications of statistical analysis in a geographical context. The book assists students in the development of competence in the statistical procedures necessary to conduct independent investigations, field-work, and related geographical research projects.
The book explains statistical techniques…mehr
Andere Kunden interessierten sich auch für
- Michael DormanIntroduction to Web Mapping284,99 €
- Manual of Digital Earth40,99 €
- International Encyclopedia of Geography, 15 Volume Set3.417,99 €
- Victoria LawsonMaking Development Geography220,99 €
- Paul A. Longley / Sue M. Brooks / Rachael McDonnell / Bill MacMillan (Hgg.)Geocomputation116,99 €
- George ChoGeographic Information Science262,99 €
- Fluvial Remote Sensing for Science and Management110,99 €
-
-
-
A practice-oriented and accessible introduction to geographical statistics
In the newly revised Second Edition of Practical Statistics for Geographers and Earth Scientists, distinguished researcher Nigel Walford delivers an authoritative and easy-to-follow introduction to the principles and applications of statistical analysis in a geographical context. The book assists students in the development of competence in the statistical procedures necessary to conduct independent investigations, field-work, and related geographical research projects.
The book explains statistical techniques relevant to geographical, geospatial, earth, and environmental data. It employs graphics and mathematical notation for maximum clarity. Guidance is provided on how to formulate research questions to ensure that the correct data is collected for the chosen analysis method.
This new edition incorporates a new section on exploratory spatial analysis and spatial statistics. It also offers:
_ A thorough introduction to first principles in the statistical analysis of geographical data, including discussions of the quality, content, collection, and acquisition of geographical data
_ In-depth treatments of geographical data exploration, including the taking of statistical measures or quantities, as well as frequency distributions, probability, and hypotheses
_ Comprehensive explorations of testing times, including parametric and nonparametric tests
_ Insightful discussions of relationship investigation, including correlation and regression, as well as the spatial aspects of geographical data
Perfect for undergraduates pursuing a degree in geography, Practical Statistics for Geographers and Earth Scientists will also be a valuable tool for students in other earth and environmental sciences.
Produktdetails
- Produktdetails
- Verlag: Wiley & Sons / Wiley-Blackwell
- Artikelnr. des Verlages: 1A119526970
- 2. Aufl.
- Seitenzahl: 512
- Erscheinungstermin: 13. Februar 2025
- Englisch
- Abmessung: 244mm x 170mm
- ISBN-13: 9781119526971
- ISBN-10: 1119526973
- Artikelnr.: 63587174
- Herstellerkennzeichnung
- Libri GmbH
- Europaallee 1
- 36244 Bad Hersfeld
- gpsr@libri.de
Nigel Walford is Professor of Applied Geographical Information Systems at Kingston University in the United Kingdom.
Preface to the Second Edition xiii
Acknowledgements xv
About the Companion Website xvii
Section I First Principles 1
1 What's in a Number? 3
1.1 Introduction to Quantitative Analysis 3
1.2 Nature of Numerical Data 7
1.3 Simplifying Mathematical Notation 12
1.4 Introduction to Case Studies and Structure of the Book 16
References 17
Further Reading 17
2 Geographical Data: Quantity and Content 19
2.1 Geographical Data 19
2.2 Populations and Samples 20
2.2.1 Probability Sampling Techniques 23
2.2.2 Subjective Sampling Techniques 35
2.2.3 Closing Comments on Sampling 38
2.3 Specifying Attributes and Variables 39
2.3.1 Geographical Phenomena as Points 42
2.3.2 Geographical Phenomena as Lines 44
2.3.3 Geographical Phenomena as Areas 47
2.3.4 Closing Comments on Attributes and Variables 49
References 50
Further Reading 50
3 Geographical Data: Collection and Acquisition 51
3.1 Originating Data 51
3.2 Collection Methods 53
3.2.1 Field Observation, Measurement and Survey 53
3.2.2 Questionnaire Surveys 57
3.2.2.1 Questionnaire Delivery 57
3.2.2.2 Question Wording 59
3.2.2.3 Questionnaire Structure 60
3.2.2.4 Questionnaire Design 61
3.2.3 Administrative Records and Documents 65
3.2.4 Interviewing, Focus Groups and Audio Recording 68
3.2.5 Crowdsourced Data 72
3.2.6 Remotely Sensed Collection Methods 74
3.2.6.1 Satellite Imagery 76
3.2.6.2 Aerial Photography 78
3.3 Locating Phenomena in Geographical Space 79
References 83
Further Reading 84
Section II Exploring Geographical Data 87
4 Statistical Measures (or Quantities) 89
4.1 Descriptive Statistics 89
4.2 Spatial Descriptive Statistics 91
4.3 Central Tendency 94
4.3.1 Measures for Non-spatial Data 94
4.3.2 Measures for Spatial Data 97
4.3.3 Distance Measures for Spatial Data 106
4.4 Dispersion 110
4.4.1 Measures for Non-spatial Data 110
4.4.2 Measures for Spatial Data 112
4.5 Measures of Skewness and Kurtosis for Non-spatial Data 116
4.6 Closing Comments 120
References 121
Further Reading 121
5 Frequency Distributions, Probability and Hypotheses 123
5.1 Frequency Distributions 123
5.2 Bivariate and Multivariate Frequency Distributions 129
5.3 Estimation of Statistics from Frequency Distributions 136
5.4 Probability 139
5.4.1 Binomial Distribution 142
5.4.2 Poisson Distribution 145
5.4.3 Normal Distribution 147
5.5 Inference and Hypotheses 153
5.6 Connecting Summary Measures, Frequency Distributions and Probability
157
References 158
Further Reading 159
Section III Testing Times 161
6 Parametric Tests 163
6.1 Introduction to Parametric Tests 163
6.2 One Variable and One Sample 165
6.2.1 Comparing a Sample Mean with a Population Mean 166
6.2.2 Comparing Differences Between Pairs of Measurements for a Sample
Divided into Two Parts 176
6.3 Two Samples and One Variable 178
6.3.1 Comparing Two Sample Means with Population Means 179
6.3.2 Comparing Two-Sample Variances with Population Variances 183
6.4 Three or More Samples and One Variable 187
6.4.1 Comparing Three or More Sample Means with Population Means 187
6.5 Confidence Intervals 192
6.6 Closing Comments 194
Further Reading 194
7 Non-parametric Tests 197
7.1 Introduction to Non-parametric Tests 197
7.2 One Variable and One Sample 199
7.2.1 Comparing a Sample Mean with a Population Mean 200
7.2.2 Comparing a Sample's Nominal Counts with a Population 203
7.2.3 Comparing a Sample's Ordinal Counts with a Population 207
7.2.4 Comparing the Ordinal Sequence of Dichotomous Outcomes for a Sample
with a Population 210
7.3 Two Samples and One (or More) Variable(s) 214
7.3.1 Comparing Two Attributes for One Sample (or One Attribute for Two or
More Samples) 215
7.3.2 Comparing the Medians of an Ordinal Variable for One or Two Samples
219
7.4 Multiple Samples and/or Multiple Variables 223
7.4.1 Comparing Three or More Attributes for One Sample (or Two or More
Attributes for Three or More Samples) 224
7.4.2 Comparing the Medians of an Ordinal Variable for Three or More
Samples (or One Sample Separated Into Three or More Groups) 224
7.5 Closing Comments 231
Further Reading 231
Section IV Forming an Association or Relationship 233
8 Correlation 235
8.1 Nature of Relationships Between Variables 235
8.2 Correlation of Normally Distributed Scalar Variables 241
8.2.1 Pearson's Product Moment Correlation Coefficient 244
8.2.2 Correlating Ordinal Variables 251
8.3 Correlation of Non-normally Distributed or Ordinal Variables 251
8.3.1 Spearman's Rank Correlation 251
8.3.2 Kendall's Tau Correlation Coefficient 256
8.4 Correlation of Nominal Scale Attributes 261
8.4.1 Phi Correlation Coefficient 261
8.4.2 Cramer's V Correlation Coefficient and the Kappa Index of Agreement
264
8.5 Closing Comments 264
Further Reading 265
9 Regression 267
9.1 Specification of Linear Relationships 267
9.2 Bivariate Regression 270
9.2.1 Simple Linear (Ordinary Least Squares) Regression 271
9.2.2 Testing the Significance of Simple Linear Regression 279
9.2.2.1 Testing the Whole OLS Regression Model 279
9.2.2.2 Testing the Constants and Predicted Y Values in OLS Regression 280
9.2.3 Explanatory Power of OLS Regression and Effect of Limits in Range of
X Values 285
9.3 Non-linear Bivariate Relationships 287
9.3.1 Forms of Non-linear and Curvilinear Bivariate Relationship 288
9.3.2 Testing the Significance of Bivariate Polynomial Regression 290
9.4 Complex Relationships 295
9.4.1 Multivariate (Multiple) Regression 295
9.4.2 Testing the Significance of Multivariate Regression 300
9.5 Closing Comments 304
Reference 305
Further Reading 305
Section V Explicitly Spatial 307
10 Exploring Spatial Aspects of Geographical Data 309
10.1 Location of Spatial Entities 309
10.2 Introduction to Spatial Autocorrelation 311
10.3 Analysis of Spatial Patterns of Points 315
10.3.1 Statistics Based on Distance 315
10.3.1.1 Nearest Neighbour Analysis 315
10.3.1.2 Ripley's K Function 319
10.3.2 Statistics Based on Quadrats 323
10.3.2.1 Variance-Mean Ratio 323
10.3.2.2 Pearson's Chi-square Test 327
10.4 Analysis of Spatial Patterns of Lines 328
10.5 Analysis of Spatial Patterns of Polygons 331
10.6 Closing Comments 334
References 335
Further Reading 335
11 Analysis and Modelling of Spatial Data 337
11.1 Introduction 337
11.2 More About Spatial Autocorrelation 338
11.3 Global Spatial Autocorrelation 345
11.3.1 Join Counts Statistics 345
11.3.2 Moran's I Index with Polygon Features 355
11.3.3 Significance Testing and the Moran's I Index 372
11.3.4 Moran's I Index with Point Features 372
11.3.5 Geary C and Getis-Ord G Statistics 374
11.4 Local Measures of Spatial Association (LISA) 379
11.5 Trend Surface Analysis 387
11.5.1 Fitting a Global Surface 388
11.5.2 Dealing with Local Variation in a Surface 393
11.6 Geographically Weighted Regression (GWR) 396
11.7 Closing Comments 399
References 403
Further Reading 404
Section VI Practical Application 407
12 Practicalities of Applying, Interpreting and Visualising Quantitative
Analysis in Geographical Projects 409
12.1 Introduction 409
12.2 Summary of Results from Quantitative Analysis of Previously Used
Datasets 410
12.2.1 Isle of Wight Residents' Survey Dataset 410
12.2.2 Les Bossons Glacier Meltwater Stream Dataset 411
12.2.3 Mid-Wales Village Residents' Shopping Survey 412
12.2.4 Parked Cars and Other Vehicles along One Side of a Road 414
12.2.5 Pittsburgh Fast Food Restaurants 415
12.2.6 Sample of Farms in South-east England During the Early Years of
World War II 415
12.2.7 Moraine Debris on Les Bossons Glacier Outwash (Sandur) Plain 418
12.2.8 Slit Trenches Dug for Defensive Purposes on the South Downs,
England, During World War II 419
12.2.9 Fields Identified for Ploughing Up on Farms on the South Downs,
England, During World War II 420
12.2.10 Distribution of Dianthus gratianopolitanus on Mont Cantal in the
Auvergne, France 421
12.2.11 Index of Multiple Deprivation in the 33 London Boroughs, 2007 422
12.3 Describing and Presenting Quantitative Results in Geographical Journal
Articles 423
12.4 Software for Quantitative Analysis 425
12.4.1 Data Input and Storage 426
12.4.2 Data Processing and Statistical Software 430
12.5 Introduction to Human and Physical Geography Projects 437
12.5.1 Crime and Deprivation 437
12.5.1.1 Research Context 437
12.5.1.2 Data and Methods 438
12.5.1.3 Results 439
12.5.1.4 Discussion and Limitations 442
12.5.2 Pick Your Own Farm Enterprises 444
12.5.2.1 Research Context 444
12.5.2.2 Data and Methods 445
12.5.2.3 Results 450
12.5.2.4 Discussion and Limitations 453
12.5.3 Trees and Greenspaces in Urban Environments 454
12.5.3.1 Research Context 454
12.5.3.2 Data and Methods 454
12.5.3.3 Results 456
12.5.3.4 Discussion and Limitations 461
12.6 Closing Comments 464
References 465
Glossary 467
Index 477
Plate section: Statistical Analysis Planner and Checklist falls between
pages 159 and 161