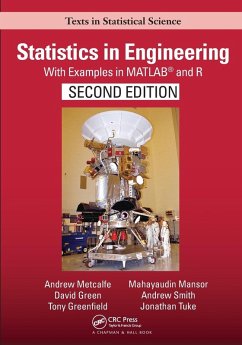
Engineers are expected to design structures and machines that can operate in challenging and volatile environments, while allowing for variation in materials and noise in measurements and signals. Statistics in Engineering, Second Edition: With Examples in MATLAB and R covers the fundamentals of probability and statistics and explains how to use these basic techniques to estimate and model random variation in the context of engineering analysis and design in all types of environments.
The first eight chapters cover probability and probability distributions, graphical displays of data and descriptive statistics, combinations of random variables and propagation of error, statistical inference, bivariate distributions and correlation, linear regression on a single predictor variable, and the measurement error model. This leads to chapters including multiple regression; comparisons of several means and split-plot designs together with analysis of variance; probability models; and sampling strategies. Distinctive features include:
All examples based on work in industry, consulting to industry, and research for industry
Examples and case studies include all engineering disciplines
Emphasis on probabilistic modeling including decision trees, Markov chains and processes, and structure functions
Intuitive explanations are followed by succinct mathematical justifications
Emphasis on random number generation that is used for stochastic simulations of engineering systems, demonstration of key concepts, and implementation of bootstrap methods for inference
Use of MATLAB and the open source software R, both of which have an extensive range of statistical functions for standard analyses and also enable programing of specific applications
Use of multiple regression for times series models and analysis of factorial and central composite designs
Inclusion of topics such as Weibull analysis of failure times and split-plot designs that are commonly used in industry but are not usually included in introductory textbooks
Experiments designed to show fundamental concepts that have been tested with large classes working in small groups
Website with additional materials that is regularly updated
Andrew Metcalfe, David Green, Andrew Smith, and Jonathan Tuke have taught probability and statistics to students of engineering at the University of Adelaide for many years and have substantial industry experience. Their current research includes applications to water resources engineering,mining, and telecommunications. Mahayaudin Mansor worked in banking and insurance before teaching statistics and business mathematics at the Universiti Tun Abdul Razak Malaysia and is currently a researcher specializing in data analytics and quantitative research in the Health Economics and Social Policy Research Group at the Australian Centre for Precision Health, University of South Australia. Tony Greenfield, formerly Head of Process Computing and Statistics at the British Iron and Steel Research Association, is a statistical consultant. He has been awarded the Chambers Medal for outstanding services to the Royal Statistical Society; the George Box Medal by the European Network for Business and Industrial Statistics for Outstanding Contributions to Industrial Statistics; and the William G. Hunter Award by the American Society for

