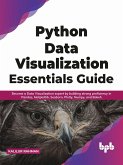
This book will introduce how data is converted into visuals for better interpretation using the programming language known as Python. If you are well versed with Python, you will easily transition into leveraging the tools available to you in Python to create appealing data visuals from a raw set of data. You will also learn to create your own machine learning models in Python to create data visualizations that will ease decision-making for you or your organization.
If you are looking to launch yourself in the world of data science and looking to use Python as the most used tool in your toolkit, this book will serve as the perfect launchpad. This book is designed to help individuals with basic Python programming knowledge to learn something new concerning the use of Python data visualization libraries in the data science domain.
The tools in this book will help you get a first impression of data science and how Python can be used extensively to create beautiful visuals to turn raw data into stories. The book will take you through:
- The need for data visualization today
- The concepts and techniques of data visualization
- The various tools available to achieve data visualization
- Data visualization libraries in Python
- The Pareto Chart
- Regression and Classification using Python
This book has been designed for you to understand data visualization using Python. There are step by step guides and images with code snippets throughout the book to help you get your hands dirty by creating your own data visuals. So, here's hoping that this book helps you find your appetite to become a data scientist with a mystery in presenting data through effective visualizations someday. Click the Buy Now button to get started!
Dieser Download kann aus rechtlichen Gründen nur mit Rechnungsadresse in A, B, CY, CZ, D, DK, EW, E, FIN, F, GR, H, IRL, I, LT, L, LR, M, NL, PL, P, R, S, SLO, SK ausgeliefert werden.


