Alle Infos zum eBook verschenken
- Format: ePub
- Merkliste
- Auf die Merkliste
- Bewerten Bewerten
- Teilen
- Produkt teilen
- Produkterinnerung
- Produkterinnerung

Hier können Sie sich einloggen

Bitte loggen Sie sich zunächst in Ihr Kundenkonto ein oder registrieren Sie sich bei bücher.de, um das eBook-Abo tolino select nutzen zu können.
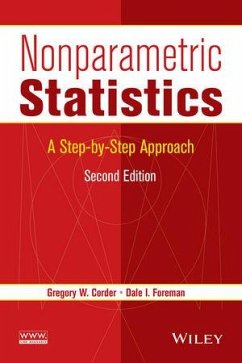
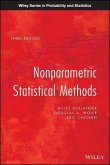
"...a very useful resource for courses in nonparametric statistics in which the emphasis is on applications rather than on theory. It also deserves a place in libraries of all institutions where introductory statistics courses are taught." -CHOICE This Second Edition presents a practical and understandable approach that enhances and expands the statistical toolset for readers. This book includes: * New coverage of the sign test and the Kolmogorov-Smirnov two-sample test in an effort to offer a logical and natural progression to statistical power * SPSS® (Version 21) software and updated screen…mehr
- Geräte: eReader
- mit Kopierschutz
- eBook Hilfe
- Größe: 13.27MB
- Stefano BonniniNonparametric Hypothesis Testing (eBook, ePUB)68,99 €
- Gregory W. CorderNonparametric Statistics (eBook, PDF)78,99 €
- Jussi KlemeläNonparametric Finance (eBook, ePUB)120,99 €
- Bruce L. BrownMultivariate Analysis for the Biobehavioral and Social Sciences (eBook, ePUB)102,99 €
- Myles HollanderNonparametric Statistical Methods (eBook, ePUB)119,99 €
- Willem E. SarisDesign, Evaluation, and Analysis of Questionnaires for Survey Research (eBook, ePUB)80,99 €
- Joachim HartungStatistical Meta-Analysis with Applications (eBook, ePUB)131,99 €
-
-
-
Dieser Download kann aus rechtlichen Gründen nur mit Rechnungsadresse in A, B, BG, CY, CZ, D, DK, EW, E, FIN, F, GR, HR, H, IRL, I, LT, L, LR, M, NL, PL, P, R, S, SLO, SK ausgeliefert werden.
- Produktdetails
- Verlag: Wiley
- Seitenzahl: 288
- Erscheinungstermin: 14. April 2014
- Englisch
- ISBN-13: 9781118840429
- Artikelnr.: 40781087
- Verlag: Wiley
- Seitenzahl: 288
- Erscheinungstermin: 14. April 2014
- Englisch
- ISBN-13: 9781118840429
- Artikelnr.: 40781087
- Herstellerkennzeichnung Die Herstellerinformationen sind derzeit nicht verfügbar.
INTRODUCTION 1 1.1 Objectives 1 1.2 Introduction 1 1.3 The Nonparametric
Statistical Procedures Presented in This Book 3 1.3.1 State the Null and
Research Hypotheses 4 1.3.2 Set the Level of Risk (or the Level of Signifi
cance) Associated with the Null Hypothesis 4 1.3.3 Choose the Appropriate
Test Statistic 5 1.3.4 Compute the Test Statistic 5 1.3.5 Determine the
Value Needed for Rejection of the Null Hypothesis Using the Appropriate
Table of Critical Values for the Particular Statistic 5 1.3.6 Compare the
Obtained Value with the Critical Value 6 1.3.7 Interpret the Results 6
1.3.8 Reporting the Results 6 1.4 Ranking Data 6 1.5 Ranking Data with Tied
Values 7 1.6 Counts of Observations 8 1.7 Summary 9 1.8 Practice Questions
9 1.9 Solutions to Practice Questions 10 CHAPTER 2 TESTING DATA FOR
NORMALITY 13 2.1 Objectives 13 2.2 Introduction 13 2.3 Describing Data and
the Normal Distribution 14 2.4 Computing and Testing Kurtosis and Skewness
for Sample Normality 17 2.4.1 Sample Problem for Examining Kurtosis 19
2.4.2 Sample Problem for Examining Skewness 22 2.4.3 Examining Skewness and
Kurtosis for Normality Using SPSS 24 2.5 Computing the Kolmogorov-Smirnov
One-Sample Test 27 2.5.1 Sample Kolmogorov-Smirnov One-Sample Test 29 2.5.2
Performing the Kolmogorov-Smirnov One-Sample Test Using SPSS 34 2.6 Summary
37 2.7 Practice Questions 37 2.8 Solutions to Practice Questions 38 CHAPTER
3 COMPARING TWO RELATED SAMPLES: THE WILCOXON SIGNED RANK AND THE SIGN TEST
39 3.1 Objectives 39 3.2 Introduction 39 3.3 Computing the Wilcoxon Signed
Rank Test Statistic 40 3.3.1 Sample Wilcoxon Signed Rank Test (Small Data
Samples) 41 3.3.2 Confi dence Interval for the Wilcoxon Signed Rank Test 43
3.3.3 Sample Wilcoxon Signed Rank Test (Large Data Samples) 45 3.4
Computing the Sign Test 49 3.4.1 Sample Sign Test (Small Data Samples) 50
3.4.2 Sample Sign Test (Large Data Samples) 53 3.5 Performing the Wilcoxon
Signed Rank Test and the Sign Test Using SPSS 57 3.5.1 Defi ne Your
Variables 57 3.5.2 Type in Your Values 57 3.5.3 Analyze Your Data 58 3.5.4
Interpret the Results from the SPSS Output Window 58 3.6 Statistical Power
60 3.7 Examples from the Literature 61 3.8 Summary 61 3.9 Practice
Questions 62 3.10 Solutions to Practice Questions 65 CHAPTER 4 COMPARING
TWO UNRELATED SAMPLES: THE MANN.WHITNEY U-TEST AND THE KOLMOGOROV.SMIRNOV
TWO-SAMPLE TEST 69 4.1 Objectives 69 4.2 Introduction 69 4.3 Computing the
Mann.Whitney U-Test Statistic 70 4.3.1 Sample Mann.Whitney U-Test (Small
Data Samples) 71 4.3.2 Confi dence Interval for the Difference between Two
Location Parameters 74 4.3.3 Sample Mann.Whitney U-Test (Large Data
Samples) 75 4.4 Computing the Kolmogorov-Smirnov Two-Sample Test Statistic
80 4.4.1 Sample Kolmogorov-Smirnov Two-Sample Test 81 4.5 Performing the
Mann-Whitney U-Test and the Kolmogorov-Smirnov Two-Sample Test Using SPSS
84 4.5.1 Defi ne Your Variables 84 4.5.2 Type in Your Values 85 4.5.3
Analyze Your Data 86 4.5.4 Interpret the Results from the SPSS Output
Window 86 4.6 Examples from the Literature 88 4.7 Summary 89 4.8 Practice
Questions 90 4.9 Solutions to Practice Questions 92 CHAPTER 5 COMPARING
MORE THAN TWO RELATED SAMPLES: THE FRIEDMAN TEST 97 5.1 Objectives 97 5.2
Introduction 97 CONTENTS vii 5.3 Computing the Friedman Test Statistic 98
5.3.1 Sample Friedman's Test (Small Data Samples without Ties) 99 5.3.2
Sample Friedman's Test (Small Data Samples with Ties) 101 5.3.3 Performing
the Friedman Test Using SPSS 105 5.3.4 Sample Friedman's Test (Large Data
Samples without Ties) 108 5.4 Examples from the Literature 111 5.5 Summary
112 5.6 Practice Questions 113 5.7 Solutions to Practice Questions 114
CHAPTER 6 COMPARING MORE THAN TWO UNRELATED SAMPLES: THE KRUSKAL-WALLIS
H-TEST 117 6.1 Objectives 117 6.2 Introduction 117 6.3 Computing the
Kruskal-Wallis H-Test Statistic 118 6.3.1 Sample Kruskal-Wallis H-Test
(Small Data Samples) 119 6.3.2 Performing the Kruskal-Wallis H-Test Using
SPSS 124 6.3.3 Sample Kruskal-Wallis H-Test (Large Data Samples) 128 6.4
Examples from the Literature 134 6.5 Summary 134 6.6 Practice Questions 135
6.7 Solutions to Practice Questions 136 CHAPTER 7 COMPARING VARIABLES OF
ORDINAL OR DICHOTOMOUS SCALES: SPEARMAN RANK-ORDER, POINT-BISERIAL, AND
BISERIAL CORRELATIONS 139 7.1 Objectives 139 7.2 Introduction 139 7.3 The
Correlation Coeffi cient 140 7.4 Computing the Spearman Rank-Order
Correlation Coeffi cient 140 7.4.1 Sample Spearman Rank-Order Correlation
(Small Data Samples without Ties) 142 7.4.2 Sample Spearman Rank-Order
Correlation (Small Data Samples with Ties) 145 7.4.3 Performing the
Spearman Rank-Order Correlation Using SPSS 148 7.5 Computing the
Point-Biserial and Biserial Correlation Coeffi cients 150 7.5.1 Correlation
of a Dichotomous Variable and an Interval Scale Variable 150 7.5.2
Correlation of a Dichotomous Variable and a Rank-Order Variable 152 7.5.3
Sample Point-Biserial Correlation (Small Data Samples) 152 7.5.4 Performing
the Point-Biserial Correlation Using SPSS 156 7.5.5 Sample Point-Biserial
Correlation (Large Data Samples) 159 7.5.6 Sample Biserial Correlation
(Small Data Samples) 163 7.5.7 Performing the Biserial Correlation Using
SPSS 167 7.6 Examples from the Literature 167 7.7 Summary 167 7.8 Practice
Questions 168 7.9 Solutions to Practice Questions 170 CHAPTER 8 TESTS FOR
NOMINAL SCALE DATA: CHI-SQUARE AND FISHER EXACT TESTS 172 8.1 Objectives
172 8.2 Introduction 172 8.3 The chi2 Goodness-of-Fit Test 172 8.3.1
Computing the chi2 Goodness-of-Fit Test Statistic 173 8.3.2 Sample chi2
Goodness-of-Fit Test (Category Frequencies Equal) 173 8.3.3 Sample chi2
Goodness-of-Fit Test (Category Frequencies Not Equal) 176 8.3.4 Performing
the chi2 Goodness-of-Fit Test Using SPSS 180 8.4 The chi2 Test for
Independence 184 8.4.1 Computing the chi2 Test for Independence 185 8.4.2
Sample chi2 Test for Independence 186 8.4.3 Performing the chi2 Test for
Independence Using SPSS 190 8.5 The Fisher Exact Test 196 8.5.1 Computing
the Fisher Exact Test for 2 x 2 Tables 197 8.5.2 Sample Fisher Exact Test
197 8.5.3 Performing the Fisher Exact Test Using SPSS 201 8.6 Examples from
the Literature 202 8.7 Summary 203 8.8 Practice Questions 204 8.9 Solutions
to Practice Questions 206 CHAPTER 9 TEST FOR RANDOMNESS: THE RUNS TEST 210
9.1 Objectives 210 9.2 Introduction 210 9.3 The Runs Test for Randomness
210 9.3.1 Sample Runs Test (Small Data Samples) 212 9.3.2 Performing the
Runs Test Using SPSS 213 9.3.3 Sample Runs Test (Large Data Samples) 217
9.3.4 Sample Runs Test Referencing a Custom Value 219 9.3.5 Performing the
Runs Test for a Custom Value Using SPSS 221 9.4 Examples from the
Literature 225 9.5 Summary 225 9.6 Practice Questions 225 9.7 Solutions to
Practice Questions 227 APPENDIX A SPSS AT A GLANCE 229 APPENDIX B CRITICAL
VALUE TABLES 235 REFERENCES 261 INDEX 265