
Alle Infos zum eBook verschenken

- Format: ePub
- Merkliste
- Auf die Merkliste
- Bewerten Bewerten
- Teilen
- Produkt teilen
- Produkterinnerung
- Produkterinnerung

Hier können Sie sich einloggen

Bitte loggen Sie sich zunächst in Ihr Kundenkonto ein oder registrieren Sie sich bei bücher.de, um das eBook-Abo tolino select nutzen zu können.
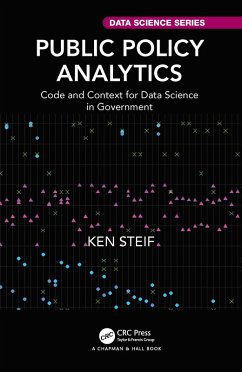
Public Policy Analytics: Code & Context for Data Science in Government teaches readers how to address complex public policy problems with data and analytics using reproducible methods in R. Each of the eight chapters provides a detailed case study, showing readers: how to develop exploratory indicators; understand 'spatial process' and develop spatial analytics; how to develop 'useful' predictive analytics; how to convey these outputs to non-technical decision-makers through the medium of data visualization; and why, ultimately, data science and 'Planning' are one and the same. A…mehr
- Geräte: eReader
- mit Kopierschutz
- eBook Hilfe
![Public Policy Analytics (eBook, PDF) Public Policy Analytics (eBook, PDF)]() Ken SteifPublic Policy Analytics (eBook, PDF)47,95 €
Ken SteifPublic Policy Analytics (eBook, PDF)47,95 €![Responsible Use of AI in Military Systems (eBook, ePUB) Responsible Use of AI in Military Systems (eBook, ePUB)]() Responsible Use of AI in Military Systems (eBook, ePUB)40,95 €
Responsible Use of AI in Military Systems (eBook, ePUB)40,95 €![Artificial Intelligence and Global Society (eBook, ePUB) Artificial Intelligence and Global Society (eBook, ePUB)]() Artificial Intelligence and Global Society (eBook, ePUB)45,95 €
Artificial Intelligence and Global Society (eBook, ePUB)45,95 €![The Stances of e-Government (eBook, ePUB) The Stances of e-Government (eBook, ePUB)]() The Stances of e-Government (eBook, ePUB)52,95 €
The Stances of e-Government (eBook, ePUB)52,95 €![Digitalization of Higher Education using Cloud Computing (eBook, ePUB) Digitalization of Higher Education using Cloud Computing (eBook, ePUB)]() Digitalization of Higher Education using Cloud Computing (eBook, ePUB)52,95 €
Digitalization of Higher Education using Cloud Computing (eBook, ePUB)52,95 €![Knowledge Guided Machine Learning (eBook, ePUB) Knowledge Guided Machine Learning (eBook, ePUB)]() Knowledge Guided Machine Learning (eBook, ePUB)42,95 €
Knowledge Guided Machine Learning (eBook, ePUB)42,95 €![Teaching Computers to Read (eBook, ePUB) Teaching Computers to Read (eBook, ePUB)]() Rachel Wagner-KaiserTeaching Computers to Read (eBook, ePUB)48,95 €
Rachel Wagner-KaiserTeaching Computers to Read (eBook, ePUB)48,95 €-
-
-
Dieser Download kann aus rechtlichen Gründen nur mit Rechnungsadresse in A, B, BG, CY, CZ, D, DK, EW, E, FIN, F, GR, HR, H, IRL, I, LT, L, LR, M, NL, PL, P, R, S, SLO, SK ausgeliefert werden.
- Produktdetails
- Verlag: Taylor & Francis eBooks
- Seitenzahl: 228
- Erscheinungstermin: 18. August 2021
- Englisch
- ISBN-13: 9781000401615
- Artikelnr.: 62284839
- Verlag: Taylor & Francis eBooks
- Seitenzahl: 228
- Erscheinungstermin: 18. August 2021
- Englisch
- ISBN-13: 9781000401615
- Artikelnr.: 62284839
- Herstellerkennzeichnung Die Herstellerinformationen sind derzeit nicht verfügbar.
Introduction
Indicators for Transit Oriented Development
1.1 Why Start With Indicators?
1.1.1 Mapping & scale bias in areal aggregate data
1.2 Setup
1.2.1 Downloading & wrangling Census data
1.2.2 Wrangling transit open data
1.2.3 Relating tracts & subway stops in space
1.3 Developing TOD Indicators
1.3.1 TOD indicator maps
1.3.2 TOD indicator tables
1.3.3 TOD indicator plots
1.4 Capturing three submarkets of interest
1.5 Conclusion: Are Philadelphians willing to pay for TOD?
1.6 Assignment - Study TOD in your city
Expanding the Urban Growth Boundary
2.1 Introduction - Lancaster development
2.1.1 The bid-rent model
2.1.2 Setup Lancaster data
2.2 Identifying areas inside & outside of the Urban Growth Area
2.2.1 Associate each inside/outside buffer with its respective town
2.2.2 Building density by town & by inside/outside the UGA
2.2.3 Visualize buildings inside & outside the UGA
2.3 Return to Lancaster's Bid Rent
2.4 Conclusion - On boundaries
2.5 Assignment - Boundaries in your community
Intro to geospatial machine learning, Part 1
3.1 Machine learning as a Planning tool
3.1.1 Accuracy & generalizability
3.1.2 The machine learning process
3.1.3 The hedonic model
3.2 Data wrangling - Home price & crime data
3.2.1 Feature Engineering - Measuring exposure to crime
3.2.2 Exploratory analysis: Correlation
3.3 Introduction to Ordinary Least Squares Regression
3.3.1 Our first regression model
3.3.2 More feature engineering & colinearity
3.4 Cross-validation & return to goodness of fit
3.4.1 Accuracy - Mean Absolute Error
3.4.2 Generalizability - Cross-validation
3.5 Conclusion - Our first model
3.6 Assignment - Predict house prices
Intro to geospatial machine learning, Part 2
4.1 On the spatial process of home prices
4.1.1 Setup & Data Wrangling
4.2 Do prices & errors cluster? The Spatial Lag
4.2.1 Do model errors cluster? - Moran's I
4.3 Accounting for neighborhood
4.3.1 Accuracy of the neighborhood model
4.3.2 Spatial autocorrelation in the neighborhood model
4.3.3 Generalizability of the neighborhood model
4.4 Conclusion - Features at multiple scales
Geospatial risk modeling - Predictive Policing
5.1 New predictive policing tools
5.1.1 Generalizability in geospatial risk models
5.1.2 From Broken Windows Theory to Broken Windows Policing
5.1.3 Setup
5.2 Data wrangling: Creating the fishnet
5.2.1 Data wrangling: Joining burglaries to the fishnet
5.2.2 Wrangling risk factors
5.3 Feature engineering - Count of risk factors by grid cell
5.3.1 Feature engineering - Nearest neighbor features
5.3.2 Feature Engineering - Measure distance to one point
5.3.3 Feature Engineering - Create the final_net
5.4 Exploring the spatial process of burglary
5.4.1 Correlation tests
5.5 Poisson Regression
5.5.1 Cross-validated Poisson Regression
5.5.2 Accuracy & Generalzability
5.5.3 Generalizability by neighborhood context
5.5.4 Does this model allocate better than traditional crime hotspots?
5.6 Conclusion - Bias but useful?
5.7 Assignment - Predict risk
People-based ML models
6.1 Bounce to work
6.2 Exploratory analysis
6.3 Logistic regression
6.3.1 Training/Testing sets
6.3.2 Estimate a churn model
6.4 Goodness of Fit
6.4.1 Roc Curves
6.5 Cross-validation
6.6 Generating costs and benefits
6.6.1 Optimizing the cost/benefit relationship
6.7 Conclusion - churn
6.8 Assignment - Target a subsidy
People-Based ML Models: Algorithmic Fairness
7.1 Introduction
7.1.1 The spectre of disparate impact
7.1.2 Modeling judicial outcomes
7.1.3 Accuracy and generalizability in recidivism algorithms
7.2 Data and exploratory analysis
7.3 Estimate two recidivism models
7.3.1 Accuracy & Generalizability
7.4 What about the threshold?
7.5 Optimizing 'equitable' thresholds
7.6 Assignment - Memo to the Mayor
Predicting rideshare demand
8.1 Introduction - ride share
8.2 Data Wrangling - ride share
8.2.1 Lubridate
8.2.2 Weather data
8.2.3 Subset a study area using neighborhoods
8.2.4 Create the final space/time panel
8.2.5 Split training and test
8.2.6 What about distance features?
8.3 Exploratory Analysis - ride share
8.3.1 Trip_Count serial autocorrelation
8.3.2 Trip_Count spatial autocorrelation
8.3.3 Space/time correlation?
8.3.4 Weather
8.4 Modeling and validation using purrr::map
8.4.1 A short primer on nested tibbles
8.4.2 Estimate a ride share forecast
8.4.3 Validate test set by time
8.4.4 Validate test set by space
8.5 Conclusion - Dispatch
8.6 Assignment - Predict bike share trips
Conclusion - Algorithmic Governance
Index
