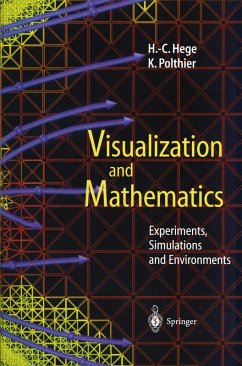
Visualization and Mathematics (eBook, PDF)
Experiments, Simulations and Environments
Redaktion: Hege, H. -C.; Polthier, K.
40,95 €
40,95 €
inkl. MwSt.
Sofort per Download lieferbar

20 °P sammeln
40,95 €
Als Download kaufen

40,95 €
inkl. MwSt.
Sofort per Download lieferbar

20 °P sammeln
Jetzt verschenken
Alle Infos zum eBook verschenken
40,95 €
inkl. MwSt.
Sofort per Download lieferbar
Alle Infos zum eBook verschenken

20 °P sammeln
Visualization and Mathematics (eBook, PDF)
Experiments, Simulations and Environments
Redaktion: Hege, H. -C.; Polthier, K.
- Format: PDF
- Merkliste
- Auf die Merkliste
- Bewerten Bewerten
- Teilen
- Produkt teilen
- Produkterinnerung
- Produkterinnerung

Bitte loggen Sie sich zunächst in Ihr Kundenkonto ein oder registrieren Sie sich bei
bücher.de, um das eBook-Abo tolino select nutzen zu können.
Hier können Sie sich einloggen
Hier können Sie sich einloggen
Sie sind bereits eingeloggt. Klicken Sie auf 2. tolino select Abo, um fortzufahren.

Bitte loggen Sie sich zunächst in Ihr Kundenkonto ein oder registrieren Sie sich bei bücher.de, um das eBook-Abo tolino select nutzen zu können.
This book is based on an international workshop held in Berlin in 1995. The workshop was met with great approval by mathematicians and computer graphic experts. It was considered a link between the fields "Visualization in Mathematics" and "Mathematical Methods in Computer Graphics".
- Geräte: PC
- ohne Kopierschutz
- eBook Hilfe
- Größe: 51.95MB
Andere Kunden interessierten sich auch für
![Shapes and Diffeomorphisms (eBook, PDF) Shapes and Diffeomorphisms (eBook, PDF)]() Laurent YounesShapes and Diffeomorphisms (eBook, PDF)72,95 €
Laurent YounesShapes and Diffeomorphisms (eBook, PDF)72,95 €![Topological Methods in Data Analysis and Visualization V (eBook, PDF) Topological Methods in Data Analysis and Visualization V (eBook, PDF)]() Topological Methods in Data Analysis and Visualization V (eBook, PDF)152,95 €
Topological Methods in Data Analysis and Visualization V (eBook, PDF)152,95 €![Data Visualization '99 (eBook, PDF) Data Visualization '99 (eBook, PDF)]() Data Visualization '99 (eBook, PDF)40,95 €
Data Visualization '99 (eBook, PDF)40,95 €![Advances in Software Tools for Scientific Computing (eBook, PDF) Advances in Software Tools for Scientific Computing (eBook, PDF)]() Advances in Software Tools for Scientific Computing (eBook, PDF)112,95 €
Advances in Software Tools for Scientific Computing (eBook, PDF)112,95 €![C-XSC (eBook, PDF) C-XSC (eBook, PDF)]() Rudi KlatteC-XSC (eBook, PDF)72,95 €
Rudi KlatteC-XSC (eBook, PDF)72,95 €![Topological Data Analysis for Scientific Visualization (eBook, PDF) Topological Data Analysis for Scientific Visualization (eBook, PDF)]() Julien TiernyTopological Data Analysis for Scientific Visualization (eBook, PDF)104,95 €
Julien TiernyTopological Data Analysis for Scientific Visualization (eBook, PDF)104,95 €![Advances in Geometric Modeling and Processing (eBook, PDF) Advances in Geometric Modeling and Processing (eBook, PDF)]() Advances in Geometric Modeling and Processing (eBook, PDF)72,95 €
Advances in Geometric Modeling and Processing (eBook, PDF)72,95 €-
-
-
This book is based on an international workshop held in Berlin in 1995. The workshop was met with great approval by mathematicians and computer graphic experts. It was considered a link between the fields "Visualization in Mathematics" and "Mathematical Methods in Computer Graphics".
Dieser Download kann aus rechtlichen Gründen nur mit Rechnungsadresse in A, B, BG, CY, CZ, D, DK, EW, E, FIN, F, GR, HR, H, IRL, I, LT, L, LR, M, NL, PL, P, R, S, SLO, SK ausgeliefert werden.
Produktdetails
- Produktdetails
- Verlag: Springer Berlin Heidelberg
- Seitenzahl: 388
- Erscheinungstermin: 6. Dezember 2012
- Englisch
- ISBN-13: 9783642591952
- Artikelnr.: 53092784
- Verlag: Springer Berlin Heidelberg
- Seitenzahl: 388
- Erscheinungstermin: 6. Dezember 2012
- Englisch
- ISBN-13: 9783642591952
- Artikelnr.: 53092784
- Herstellerkennzeichnung Die Herstellerinformationen sind derzeit nicht verfügbar.
I. Visualizing Mathematics.- The Minimax Sphere Eversion.- Exploring Plane Hyperbolic Geometry.- Visualizing Nonlinear Electrodynamics.- The Use of Computer Graphics for Solving Problems in Singularity Theory.- What Should a Surface in 4-Space Look Like?.- Animation of Algebraic Surfaces.- II. Geometric Algorithms and Experiments.- Using Symmetry Features of the Surface Evolver to Study Foams.- Constant Mean Curvature Surfaces Derived from Delaunay's and Wente's Examples.- Visualization of Periodic Tilings.- An Algorithm for Discrete Constant Mean Curvature Surfaces.- III. Visualization Algorithms and Data Structures.- Efficient Calculation of Subdivision Surfaces for Visualization.- Fast Line Integral Convolution for Arbitrary Surfaces in 3D.- Visualization of Parallel Data based on Procedural Access.- IV. Visualization Environments.- A new 3D Graphics Library: Concepts, Implementation, and Examples.- A Generic Approach to Computer Graphics.- MRT - A Visualization Tool Addressing Problems 'outside' the Classical Rendering Domain.- Oorange: A Virtual Laboratory for Experimental Mathematics.- Linear Inductive Reductive Dataflow System for ViSC.- See what I mean? Using Graphics Toolkits to Visualise Numerical Data.- V. Visualization and Simulation Techniques.- Numerical Algorithms and Visualization in Medical Treatment Planning.- Level Set Methods for Curvature Flow, Image Enchancement, and Shape Recovery in Medical Images.- Numerical Methods, Simulations and Visualization for Compressible Flows.- Appendix: Color Plates.
I. Visualizing Mathematics.- The Minimax Sphere Eversion.- Exploring Plane Hyperbolic Geometry.- Visualizing Nonlinear Electrodynamics.- The Use of Computer Graphics for Solving Problems in Singularity Theory.- What Should a Surface in 4-Space Look Like?.- Animation of Algebraic Surfaces.- II. Geometric Algorithms and Experiments.- Using Symmetry Features of the Surface Evolver to Study Foams.- Constant Mean Curvature Surfaces Derived from Delaunay's and Wente's Examples.- Visualization of Periodic Tilings.- An Algorithm for Discrete Constant Mean Curvature Surfaces.- III. Visualization Algorithms and Data Structures.- Efficient Calculation of Subdivision Surfaces for Visualization.- Fast Line Integral Convolution for Arbitrary Surfaces in 3D.- Visualization of Parallel Data based on Procedural Access.- IV. Visualization Environments.- A new 3D Graphics Library: Concepts, Implementation, and Examples.- A Generic Approach to Computer Graphics.- MRT - A Visualization Tool Addressing Problems 'outside' the Classical Rendering Domain.- Oorange: A Virtual Laboratory for Experimental Mathematics.- Linear Inductive Reductive Dataflow System for ViSC.- See what I mean? Using Graphics Toolkits to Visualise Numerical Data.- V. Visualization and Simulation Techniques.- Numerical Algorithms and Visualization in Medical Treatment Planning.- Level Set Methods for Curvature Flow, Image Enchancement, and Shape Recovery in Medical Images.- Numerical Methods, Simulations and Visualization for Compressible Flows.- Appendix: Color Plates.
